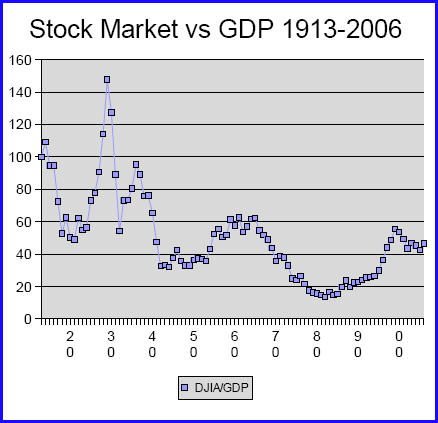
Haste does indeed make waste. Finding myself with too little time to put together a more ambitious set of comparisons, I blindly grabbed the wrong pair of data sets, one in constant dollars, the other in current ones. So, I'm demoting my original misleading material below the fold and replacing it with this chart showing how the ratio between the Dow Jones Industrial Average and the GDP has changed over time:
While it does show--in comparison to the original chart, now below--is a similar increase in the Dow vs. GDP since 1980, what's striking is that this is part of a quite varied history preceeding it. The most obvious conclusion that I can draw from this is that it's simply too simple or crude a comparison to get our hands around what's really going on, in part because there are now many other, more exotic markets in which big investors place their money, and in part because volume of funds matters as well as price.
I was, of course, aware of these facts, but it's often the case that added dimensions aren't necessary to get at important facts. It's downright spooky, for example, that public opinion scholar James Stimson was able to identify underlying cycles that account for the vast majority of coherent cyclic change in American public opinion across dozens of issue areas. This time, however, not so much. So the question is: what should I be measuring???
So, like I just said, how can I learn from my hasty mistake? What should I be measuring???
I know, for example, that finance as a percentage of the economy has grown significantly, and that, of course, this feeds back into GDP. What I want to get at is how much financial investment there is that is largely just speculative and non-productive--or even counterproductive, in the sense of diverting resources from productive purposes.
I know that there's not firm dividing line between productive and non-productive, as a certain amount of speculation must be involved to hedge against droughts, for example, and that such speculation serves a productive function, even though it's not the same as investing in direct improvements. But I know whatever I do is going to be a rough measure. I'm just concerned that it have a clear logic to it, and that it be something there's decent public data for.
So, any ideas?
Don't Do This At Home, Kids!
Here's the original, erroneous post, which people have responded to below:
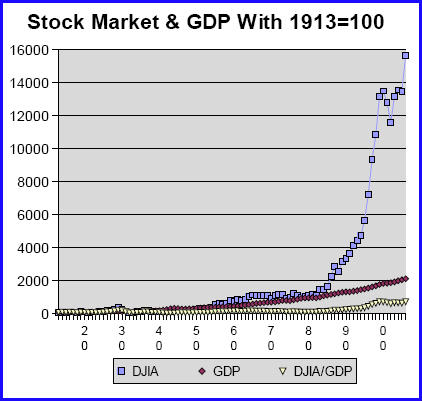
Here's a simple picture of our economy since just before WWI. Taking 1913=100, here's how the year-end Dow Jones Industrial Average (DJIA) and the annual Gross Domestic Product (GDP) have grown over time. If it looks like the economy changed radically in the early 1980s, well, that's because it did:
This chart should be both sobering and reassuring. Sobering in that it tells us that the stock market gains of the past 20+ years really aren't sustainable, and probably weren't such a good thing in the first place. Reassuring because maintaining the much steadier pace of GDP growth is probably both a more realistic and more important goal.
Of course there is considerable linkage between Wall Street and Main Street. We're reminded of that 20 times a day of late. But this chart reminds us of just how elastic that linkage can be.
As late as 1982, the Dow had only grown 13% more since 1913 than the GDP. But from there on, the growth rates diverged wildly:
And note, the divergence more than doubled under Bill Clinton--from 299.02 in 1992, the year before he took office, to 730.42 the year he left. Clinton was certainly better for the average American than Reagan or either of the Bushes, but he didn't do anything to alter the fundamental logic of the economy. He just made things a little nicer on the side.
That era is over now. Let's hope that Obama realizes that sooner, rather than later, and has both the strength and the wisdom to realize the need to lead in a new direction.
Help us sustain our work by taking our reader survey. If you've already taken it, just click on the link, and your responses will be added to our results.