| Here's both parties together, represented just by the curves:
Click to enlarge.
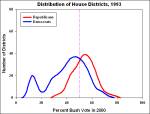
Here's a little animation showing the distribution of House seats from 1993 to now:
Click to animate.
Here's each year separately: 1993, 1995, 1997, 1999, 2001, 2003, 2005.
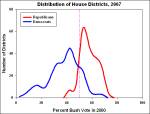
There is a problem with these charts, and that is the ideological composition of the districts is not static. Populations change. From 1990-2000, though, only 10% of counties had a change in population of more than 30%, so we're probably pretty safe extending the use of 2000 data seven years forward and back. As far as where people fall on the political spectrum, let's assume for now that nobody changes their minds about their values. Furthermore, we'll use the 2000 vote as a proxy for the conservative/liberal spectrum; in this case, we have good numbers from the 2000 exit polls showing 80% of liberals voted for Gore and 81% of conservatives voted for Bush.
The most striking thing is to watch the evolution of the Republican party as it narrows to a right-wing faction. In 1993, the country had a center/right party (Republicans) and a center/left/urban party (Democrats). Democrats and Republicans were both 'big tent' parties, for better or for worse (Democrats had a few bugs in the tent lining). In 1994, the Republicans made gains deep into moderate territory. From 1996 to 2004, the parties generally poached seats held by the other party in their own turf, followed by Democrats consolidating seats below 50% and pushing into Republican territory in 2006. Now, Democrats have a slightly smaller tent with some dogs tied to the outside, but Republicans only have a lean-to, albeit a tall lean-to. Democrats still manage to elect Representatives from nearly the entire spectrum of districts in the country, which certainly helps explain why it is so difficult for Democrats to govern. Moderate Republicans, on the other hand, are nearly extinct. The overlap between the two parties has grown smaller as well over the years, which is probably linked to the increase in partisanship.
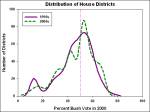
There is quite a change in 2002 as a result of redistricting. Let's look at the total distribution of seats, Republican and Democrat, before and after redistricting:
Click to enlarge.
Wow! What an … interesting change. Prior to the 2000 census redistricting, we see a distribution that is common for all sorts of measurements - similar to the well-known bell curve, but skewed to one side - plus a little bump at the left for urban districts. There are no districts that come anywhere near to being as far to the right as the urban core districts are to the left. Even if you squeeze all the most conservative counties in the country into a few districts, you could only create two or three districts with an 80-90% level of support for Bush in 2000. If we judge by the range of districts, then, the nation's middle is at 45% - squarely captured by Democrats. We represent moderation.
Then came the redistricting. The strategy of Republicans is clear: push as many seats as possible just over the 50% line. Now we have a strange distribution that looks like a camel that was swallowed by a snake. This should have worked perfectly to ensure a Permanent Republican Majority. Right?
Clearly not. From the animation above, we see the Blue Wave washing right over the 50% line and sweeping seats into the sea. The question is, was this a one-time event, or a first step? Current conditions indicate the wave is still there today. Next year - who knows?
Once Republicans were safely ensconced in their supposedly safe districts, did the party calculate that it could shift even further to the right without penalty? Did it figure it could ditch the party moderates and pick up the remaining districts that voted for Bush? Based on the hubris of Karl "The Math" Rove, it very may well have. And that may have been part of its undoing. |


 Design by Politics by Design, Powered by: SoapBlox