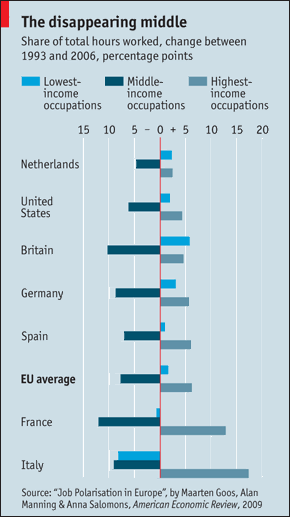
Change in share of total hours worked by lowest, middle and highest income occupations between 1993 and 2006
This all happened before the financial crisis that triggered the Great Recession.
We're not alone, and we're not the worst. It's a pervasive trend among the established Western industrial democracies. But since we have the weakest welfare state to help soften the blow, and the deepest ideological antipathy to doing anything about it.... Well, let's just say that this chart gives an indication of how badly screwed we are right now, since (a) the global oligarchs are in denial about the ongoing Great Recession & what needs to be done about it, and (b) this chart shows--from yet another perspective--that the problems began long before the Great Recession started.
"Their income is our cost" is NOT a very powerful meme
I dare anybody to try it out, on a selection of their friends, family, and acquaintances. If might be a big deal for lefties, but I doubt most people will get excited about it.
What most people can relate to, much more easily, is the impossibility of competing against a foreigner who makes 5 cents on the dollar that you do, other factors being equal.
Before addressing what metamars said here, I want to hasten to add that I know metamars is not being intentionally racist. But intentional racism is not the issue, and hasn't been for quite some time now. And yet, the racist implications to thinking like this are clear. As I explained to fladem, when he echoed metmars:
Chinese Workers Didn't Steal Our Jobs
American CEOs STOLE them, and gave them to Chinese workers at a fraction of the pay.
One narrative is FALSE, and pits workers of different nationalities against one another.
The other narrative is TRUE, and pits workers of all nationalities against the CEOs who exploit them.
I'm not uncomfortable with populism. I'm uncomfortable with RACISM and LIES.
So, with that out of the way, let's return to what metamars wrote. First off, of course, what I'm suggesting here is not a popular meme. We have centuries of elite brainwashing to thank for that. But as times get worse, if work hard enough it could well become a popular meme--because, of course, it's true.
But in one sense, it is surely is not a powerful meme right now, because people are just too beaten down, and it's so much easier to blame someone else who's powerless and preferrably far away, so we can blame some faceless "other", and then feel better in our continuing misery. There's a struggle necessary to get people in touch with their own power before a meme like this can be powerful rather than debilitating.
There's a parallel here to the dynamic discussed in the first diary spin-off from that diary, "Conservatives stoke resentment between worse off & better off workers to prevent solidarity". Like it or not, as Oaktown Girl pointed out, the meme of blaming better-paid workers is a powerful one, because people lack the confidence as well as the imagination to instead think, "That's what we all should have" instead of "Why do they have that? Let's take it away from them!"
Well, blaming worse-paid workers in the Third World isn't a whole lot better, either. They're not the ones in charge. They're not the ones who are doing it to you.
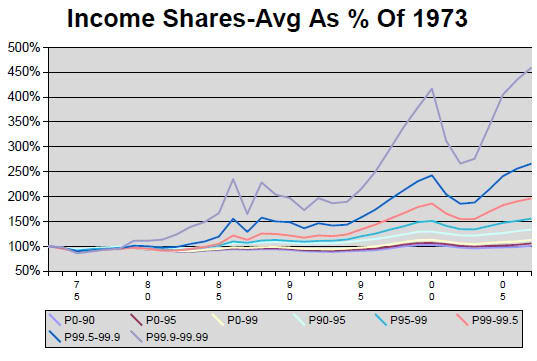
My friend Paul Krugman (hey, he linked to me, I can pretend) posts this chart from Emmanuel Saez, which shows that in 2007 the top 0.01% of income earners in America took home 6% of the national income.
Let's get some scale here. In 2007 there were 301M people in America, which gives us 30,100 people in that top 0.01%. CIA Factbook says US GDP for 2007 was $14.11T in PPP US dollars. 6% of that is $846B. So the top 0.01% averaged $28 million dollars in income, each. Wow. That isn't quite correct since Saez is actually using "tax units" rather than people for his top 0.01% so this might only represent 12-15K actual IRS tax returns, and you probably can't divide GDP quite that neatly, but we're still talking about a tiny number of people taking an inordinate piece of the pie.
Following Krugman's link to Saez, I found this chart (which I snazzified):
Note this is now the top 0.1% (vice top 0.01% in Krugman's post). Check out the blue (the bottom chunk for the colourblind). That's employment income. Contrast the share of their income that salary made up between the classic gilded age (c1929) and the modern one, and see how much bigger a share is coming from salary (and bonus). Otherwhere in the data (fig4) Saez gives you the percentages of each category of income for the top 0.1%, where you can learn that in 1929, captial gains made up about 65% of the income of the top 0.1ers, and employment income was 20%. Skip to 2007, and employment now makes up almost 50%, with capital gains down at 20% (remainder is something called "entrepreneurial income" for which I can't locate a definition).
I post this because we are regularly exposed to anecdotal stories of how much this or that CEO makes, or some trader's obscene bonus, but it is important to have some data that shows this is a real phenomenon and not just a few isolated exceptions blown out of proportion. It turns out that $70 million here and $16 billion there and pretty soon you're talking about real money. Upper management in America's corporations really are emptying the till like never before.