This is the first part of a series of posts analyzing the swing state Colorado. The second part can be found here.
Starting six years ago, a massive Democratic wave swept through the state of Colorado. Starting with the election of former Senator Ken Salazar, the Democratic Party took control of almost every state office there was to take. The results of this transformation are pictured in the table above.
A fascinating part of politics is exploring what makes people vote as they do. The political belief that a person holds often is linked with something entirely unrelated. Several studies have shown correlations between, for instance, personality traits or hormone levels and support for the Democratic or Republican Party.
One such study was undertaken by Hotline and the National Journal, which can be found here. They compared the relationship between the sports people watch, the national parties they vote for, and their turn-out rate.
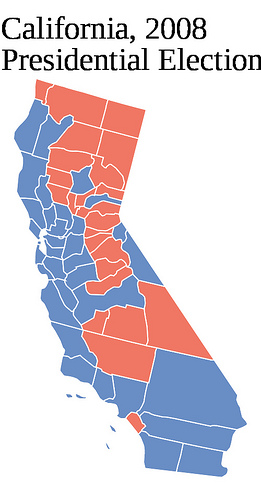
When Republicans attack American liberalism, they prefer to use San Francisco as a punch bag. Indeed, San Francisco does constitute quite a liberal city; in the 2008 presidential election, 84.0% of the good folk of San Francisco preferred Democratic candidate Barack Obama over Senator John McCain.
San Francisco was far from the most Democratic-voting city in 2008, however. Mr. Obama’s percentage total was greater in several places; Washington D.C., for instance, pummeled San Francisco in the contest of who votes more loyally Democratic. In the capital of America, an astonishing 92.5% of voters supported the Illinois senator.
Most people who will hear this will probably start thinking something quite politically incorrect. The line of thought goes that “Washington is full of black people, all the blacks voted for Obama, so of course it voted that way.”
This is the last part of a series of posts analyzing competitive Senate elections in blue states. It is the second section of two posts focusing on the greatest state in the union (otherwise known as California). The first part of the series can be found here.
Suburban SoCal
Southern California (SoCal, in short) is where the battle for California will be won or lost. Ms. Fiorina must accomplish two tasks in the region.
First, she must clean the clock in the suburban counties outside Los Angeles.
This is the third part of a series of posts analyzing competitive Senate elections in blue states. It will focus on California. Because California is such a big and complicated state, it will have two sections – of which this is the first. The second part can be found here.
California, Section 1
In the greatest state of the union, a fierce senatorial battle is brewing. Former HP executive Carly Fiorina is mounting a tough challenge to incumbent Democrat Barbara Boxer. In an anti-Democratic national environment, polls show the race close and competitive. This post will examine the obstacles Ms. Fiorina will face as she seeks to overcome California’s formidable Democratic geography.
As America’s most populous state, California contains a number of distinct regions. This post, and the one following, will examine each.
On Tuesday night Pennsylvania’s 12th congressional district held a special election, pitting Democratic candidate Mark Critz against Republican Tim Burns.
Mr. Critz won solidly: a nine percent margin of victory off 53.4% of the vote. Severalpolls had predicted a very close, photo-finish election; this result contradicted that assumption.
This victory constitutes good – very good – news for Democrats.
This is the second part of three posts analyzing the congressional districts President Barack Obama underperformed in. It will focus on his relative weakness in the northeast. The third part can be found here.
The Northeast
In my previous post I created a map of congressional districts in which Mr. Obama performed worse than Senator John Kerry:
In this map the most obvious pattern is a roughly diagonal corridor of Republican-shifting congressional districts, stretching from Oklahoma and Louisiana through the Appalachians. This area has long been seen as a place in which the electorate is moving away from the Democratic Party.
The post then looked at the Northeast, another region in which Mr. Kerry did better than Mr. Obama.
To follow up the series on Virginia, I’ve posted a few recent presidential elections in the state (courtesy of the New York Times). Each map comes with some brief analysis.
Capitalizing on a decade of Democratic movement, Senator Barack Obama becomes the first Democratic presidential candidate to win Virginia since 1964. The Senator performs best in eastern Virginia, especially the fast-growing northern Virginia metropolis. Western Virginia is not as enamored; parts of it even vote more Republican.
This is the last part of a series of posts analyzing the swing state Virginia, which aims to offer some concluding thoughts. The previous parts can be found starting here.
Conclusions
As a state, Virginia’s population has always been located in three metropolitan areas: the Northern Virginia suburbs south of Washington D.C., Richmond and its suburbs, and the communities surrounding Hampton Roads. Together these three places compose more than half of Virginia’s electorate:
In all three metropolitan areas, Democrats have been improving their margins.
This is the fifth part of a series of posts analyzing the swing state Virginia. It focuses on the traditional Democratic base and its decline. The last part can be found here.
In the days of the Solid South, Democrats worried more about primary elections than Republican challengers. The party, under the sway of the Byrd machine, dominated almost every part of the state – as it did throughout the South.
Civil rights and suburban growth broke the back of this coalition. In 1952 Virginia voted for Republican candidate Dwight Eisenhower. By the 1970s Virginia had elected its first Republican governor, senator, and attorney general in nearly a century.
Democrats were left with strength in two reliable regions – the southeast and the western panhandle. These places constituted the traditional Democratic base, which Democrats relied on for a number of decades.
The 1996 presidential election provides an excellent illustration of this base:
This is the first part of a series of posts analyzing competitive Senate elections in blue states. The third part, which analyzes California, can be found here.
Out of the three heavily Democratic states being analyzed, Republicans probably have the least chance of winning New York. A serious Republican challenger to Senator Kristen Gillibrand has yet to emerge. Moreover, Ms. Gillibrand has proven an adept politician willing to campaign hard.
Nevertheless, in a bad national environment with low name recognition, victory for Democrats is not assured. Under the right circumstances (perhaps a Gillibrand scandal), Republicans may be able to pull off a shocker.
Like Illinois, New York can be divided into three sections: upstate, the suburbs downstate, and New York City. A New York Republican must win upstate and the suburbs by substantial margins – and perform extremely well in New York City.
A few maps of Pennsylvania’s presidential elections are posted below, for your enjoyment. Each map comes with some brief analysis. Note how in each succeeding election, Democratic margins in the Philadelphia metropolis increase, while their margins in the Pittsburgh corridor decrease.
(Note: Because the Times stopped updating before all absentee/provisional ballots were counted, this map does not fully reflect the actual results. I have corrected the discrepancy.)
As the national tide increasingly turns in Senator Barack Obama’s favor, Senator John McCain mounts a quixotic attempt to win Pennsylvania. While Mr. McCain improves in the southeastern rustbelt, Democratic dominance in eastern Pennsylvania ensures a double-digit blue margin.
This is the fourth part of a series of posts analyzing the swing state Virginia. It is the second section of two focusing on Northern Virginia, and focuses on analyzing the structural foundation behind NoVa’s Democratic shift. The fifth part can be found here.
Demographics
In many ways, Northern Virginia represents the best America has to offer. As wealthy, diverse, and rapidly growing suburb, it offers the very essence of the American Dream.
This is the third part of a series of posts analyzing the swing state Virginia. It is the first section of two focusing on Northern Virginia. The fourth part can be found here.
NoVa
A vast and growing suburban metropolis, Northern Virginia has become increasingly important in Virginia politics. There, demographic changes have imperiled Republican dominance of Virginia.
To illustrate the exceptional nature of this movement, compare the two elections below. Here is 2000:
Eight years later, Northern Virginia has transformed:
A number of commentators have lamented increasing polarization in Washington. Conventional wisdom has it that America is as divided and partisan as it ever has been. Sectional divisions are tearing this country apart and preventing problems such as the deficit from being addressed; the differences between blue America and red America, in this view, are rapidly approaching crisis point.
There is some justice to this view. Polarization has probably increased, by a number of metrics, over the past few elections. Indeed, I previously noted something to this exact effect.
Let’s take another look, however, at the hypothesis, using a different type of measurement. Do blue states elect Republican representatives, and vice versa? In a polarized nation, this would probably not be the case.
Here is the House today:
Here is 1894:
As this stark contrast illustrates, perhaps polarization ain’t so bad as it used to be.